
As far as architectural aphorisms go, Mies van der Rohe’s ‘Less is More’ seems to succinctly define a modernist ethic. What’s less well known however, is that van der Rohe wasn’t actually the originator of the phrase, even if it did come to be inextricably linked with him. The pithy observation was, in fact, given its first airing by Peter Behrens, a godfather figure to the young Mies who he drafted in to work on aspects of the AEG Turbine Factory in Berlin, between 1907 and 1910.
As recounted by the late Detlef Mertins in the exceptional monograph Mies, the 21-year-old van der Rohe recalled designing the glazing of the west, courtyard elevation of the AEG Turbine Factory, which is considerably more utilitarian in character than the grand street elevation. Beyond the determinants of the technical form Mies said that what he contributed was “indeed almost nothing”. And it was in working on this elevation that Mies first came across the infamous expression, ‘less is more’.
Simplicity is better than elaborate embellishment
“I heard it in Behrens’s office for the first time,” he later recalled. “I had to make a drawing for a facade for a factory. There was nothing to do on this thing. The columns were 5.75 meters (19 feet). I will remember that until I die. I showed him a bunch of drawings of what could be done and then he said, ‘Less is more’,” but “he meant it in another way than I use it.”
So what does it mean? Particularly for database connections, you must wonder.
Apache vs Nginx

Why is it that with only 4 threads, an nginx web server can substantially out-perform an Apache web-server with 100 processes?
A web server constantly sends out pieces of information to users in order to compose web pages. It constantly performs I/O operations to read static content from a file system, which it then has to place on a network to reach the requesting user — referred to as a read/write request cycle. All of these operations have wait times, preoccupying a web server process until it has dispensed off with the request. The higher the wait time, the longer the thread is tied up.
Apache works by using a dedicated thread per client with blocking I/O.
Apache works in a blocking I/O model using a dedicated thread per client which means that when a read/write request is issued, it blocks other requests until it is completed. A best solution to this problem is to create separate threads/processes for each connection. This is what Apache does.
Although the dedicated thread per connection/request by Apache is a good method to serve clients, it’s an expensive proposition on memory and processing resources. It’s processor consuming, because for each request that hits the Apache server, the processor has to context switch between different processes; because each http request creates a new process/thread.
Nginx uses an event-driven approach
Nginx uses a single threaded non-blocking I/O mechanism to serve requests. As it uses non-blocking I/O, one single process can serve as many requests. Basically, Nginx was made to solve a problem that is known as C10K.
Time Slicing

Even a computer packing a single CPU core can “simultaneously” support dozens or hundreds of threads. It’s merely a neat trick by the operating system though the magic of time-slicing. In reality, that single core can only execute one thread at a time. The OS then switches context and that core executes code belonging to another thread; CPU scheduling.
It is a basic Law of Computing that given a single CPU resource, executing tasks A and B sequentially will always be faster than executing tasks A and B “simultaneously” through time-slicing. That’s because context switches are expensive on resources. Once the number of threads exceeds the number of CPU cores, you’re going slower by adding more threads.
For databases, there are a few other factors at play.
When we look at what the major bottlenecks for databases are, we can summarize them into three basic categories: CPU, disk and network. We could throw memory in there as well, but compared to disk and network there are several orders of magnitude difference in bandwidth.
On a server with 8 computing cores, disk and network notwithstanding, setting the number of connections to 8 would provide optimal performance. Anything above that number starts to slow things down due to the overhead of context switching.
We can’t ignore disk and network.
Databases typically store data on a disk, which traditionally is comprised of spinning plates of metal with read/write heads mounted on a stepper-motor driven arm. The read/write heads can only be in one place at a time (reading/writing data for a single query) and must “seek” to a new location to read/write data for a different query hence a seek-time and a rotational cost; the disk has to wait for the data to “come around again” on the platter to be read/written.
Network is similar to disk. Writing data out over the wire, through the ethernet interface, can also introduce blocking when the send/receive buffers fill up and stall. A 10-Gigabit ethernet pipe is going to stall less than Gigabit ethernet, which will stall less than a 100-megabit. It is however quite a negligible factor, especially if everything is in the same network.
During this time (“I/O wait”), the connection/query/thread is simply “blocked” waiting on the disk during which time the OS could put that CPU resource to better use by executing some more code for another thread. Thus, because threads become blocked on I/O, we can actually get more work done by having a number of connections/threads that is greater than the number of physical computing cores.
But how many more?
Connection Pooling

Imagine a service that often has 10,000 user connections making database requests simultaneously — accounting for some 20,000 transactions per second. Opening a database connection on each of the 10k requests, even if resources would allow, is nothing short of insanity. Such a model would not scale because the connections are directly proportional to the number of requests. Perhaps even more damning is the fact that resources are limited thus no database has the capacity to support such a huge number of concurrent connections.
You want a small pool, saturated with threads waiting for connections.
If you have 10,000 front-end users, having a connection pool of 10,000 is counterproductive. 1000 is still horrible. Even 100 connections is an overkill. You want a small pool of a few dozen connections at most, and you want the rest of the application threads blocked on the pool awaiting connections.
Pool Sizing
How big should your connection pool be? You might be surprised that the question is not how big but rather how small!
The PostgreSQL project provides a formula to calculate a pool size starting point for an optimal throughput — which they say has held up pretty well across a lot of benchmarks for years and that’s largely applicable across databases:
connections = ((core_count * 2) + effective_spindle_count)
Core count should not include HT threads, even if hyperthreading is enabled. Effective spindle count is zero if the active data set is fully cached, and approaches the actual number of spindles as the cache hit rate falls. There hasn’t been any analysis so far regarding how well the formula works with SSDs. You should test your application, i.e. simulate expected load, and try different pool settings around this starting point.
The prospect of “pool-locking” has been raised with respect to single actors that acquire many connections but it is largely an application-level issue. Increasing the pool size can alleviate lockups in these scenarios, but it’s advisable to first explore an application level solution before enlarging the pool.
The calculation of pool size in order to avoid deadlock is a fairly simple resource allocation formula:
pool size = Tn * (Cm — 1) + 1
where:
- Tn is the maximum number of threads
- Cm is the maximum number of simultaneous connections held by a single thread
For example, with a maximum of three threads (Tn=3), each of which requires four connections to perform some task (Cm=4). The pool size required to ensure that deadlock is never possible is:
pool size = 3 x (4–1) + 1 = 10
This is not necessarily the optimal pool size, but the minimum required to avoid deadlock.
My Little Experiment
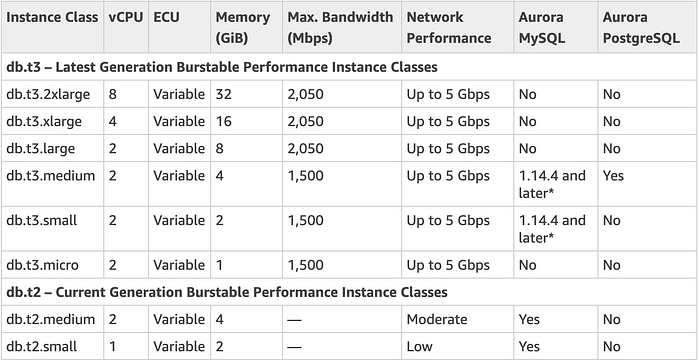
Recently, I was carrying out some load and performance profiling on one of my team’s services looking for application optimization points and I was astounded by the performance of the database, an Amazon Aurora MySQL db.t2.small.
Below are hardware specifications for some of the available database instance classes including db.t2.small, with 1 vCPU and 2GiB of memory:
The service itself is pretty straightforward — and dumb — with very little complexity. It receives a request with a JSON payload containing some data, queries the database for stored templated text and renders it by performing substitution with variables from the received payload.
For my tests, I employed Locust to generate and send synthetic traffic the way of the service running two containers on an EKS cluster. I started out with 100 concurrent users and a hatch rate of 20 generating about 85k requests at a peak TPS of 102/s.
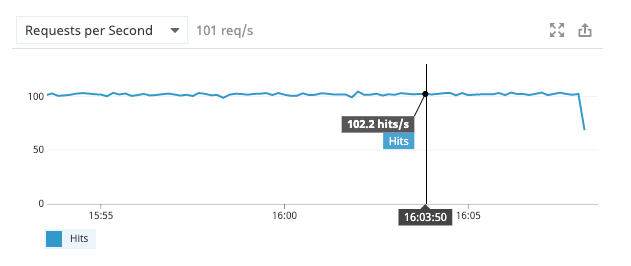
Well, I was being conservative because I “knew” the database to be a “paltry” t2.small instance that would suffer if I dared go higher. How wrong I was. To be fair, I was suffering a serious case of prior knowledge bias; the curse of knowledge if you will. You see, databases are a big paint for most people, and we are not an exception. We have certainly had our days with them, especially when there’s a little bit more traffic than usual.
I remember when we started “productionizing” this particular service, my team had a lengthy chat about what database to use. The word million was thrown around quite a lot; performance with a million rows, a million requests per second. Back then, we were seriously looking at leveraging Amazon DynamoDB’s promised single digit millisecond latency. Throw in autoscaling and we were sold. We must have decided that it was a case of premature optimization. Besides, in a service that renders content from stored templates, a million rows of unique records means something is seriously wrong because the degree of commonality is quite low. That’s how we ended up leaving the service with an Aurora database that it was already on.
Amazon Aurora is a supercharged and highly optimized relational database engine that’s compatible with both MySQL and PostgreSQL that will give you improved performance over typical MySQL or PostgreSQL databases.
Below are some of the database and application metrics that I gathered:

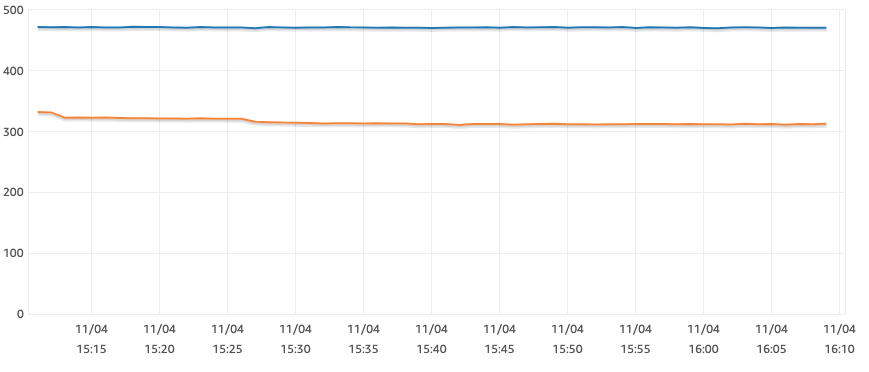


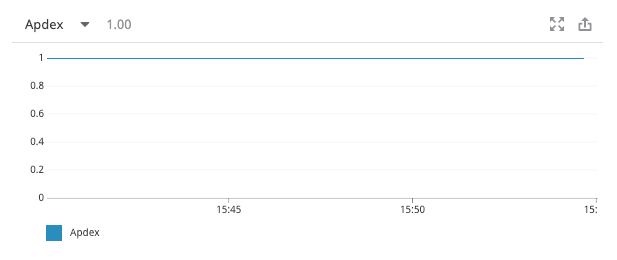
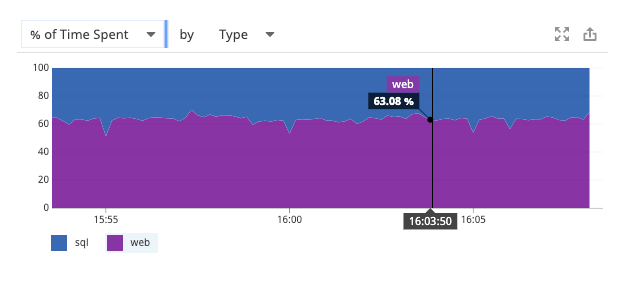
So good was the database, a t2.small with 1vCPU and 2Gigs of memory, that a significant percentage of the time was spent in the application at about 63%. We are talking 63% of single digit millis but it’s still rather interesting.
When I got digging, puzzled by the numbers, I found that we had been wise and fronted the database with a HikariCP pool with a maximum of only 10 connections. That’s right. Ten.
Summary
How big should your connection pool be? You might be surprised that the question is not how big but rather how small!
You want a small pool, saturated with threads waiting for connections.
References
- http://www.kegel.com/c10k.html
- https://serverguy.com/comparison/apache-vs-nginx/
- https://www.phaidon.com/agenda/architecture/articles/2014/april/02/what-did-mies-van-der-rohe-mean-by-less-is-more/
- https://github.com/brettwooldridge/HikariCP/wiki/About-Pool-Sizing
- https://www.dailymotion.com/video/x2s8uec
- https://docs.aws.amazon.com/AmazonRDS/latest/AuroraUserGuide/CHAP_AuroraOverview.html
- https://aws.amazon.com/dynamodb/?sc_channel=PS&sc_campaign=acquisition_AE&sc_publisher=google&sc_medium=dynamodb_hv_b&sc_content=dynamodb_e&sc_detail=dynamodb&sc_category=dynamodb&sc_segment=80033632029&sc_matchtype=e&sc_country=AE&s_kwcid=AL!4422!3!80033632029!e!!g!!dynamodb&ef_id=CjwKCAiA8K7uBRBBEiwACOm4d1MCzihs8EKZZa3MnaYJpQHJpRblWtkH4uLDqnIhHH-G5Vyh4CGGSBoCje0QAvD_BwE:G:s
